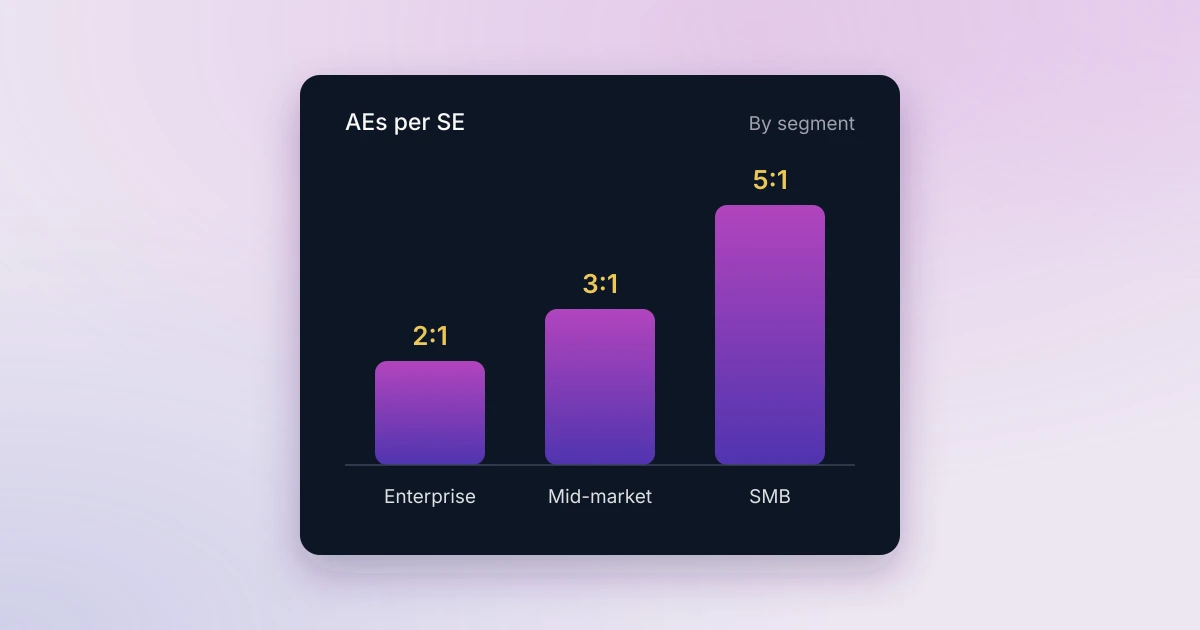
Most B2B SaaS teams run between two and four account executives (AEs) per sales engineer (SE). Consensus research puts the average AE to SE ratio at around 4:1 and suggests 3 to 4:1 is likely the most one SE can sustainably support. But the right ratio for your team depends on how complex your deals are, how many of them need an SE, and how much else your SEs are asked to do.
Treat the ratio as an output of your sales motion, not a target. This guide covers what the latest benchmarks say, why the headline number can mislead, how to calculate the ratio you actually need, and the signs it is time to change it.
What Is the AE to SE Ratio?
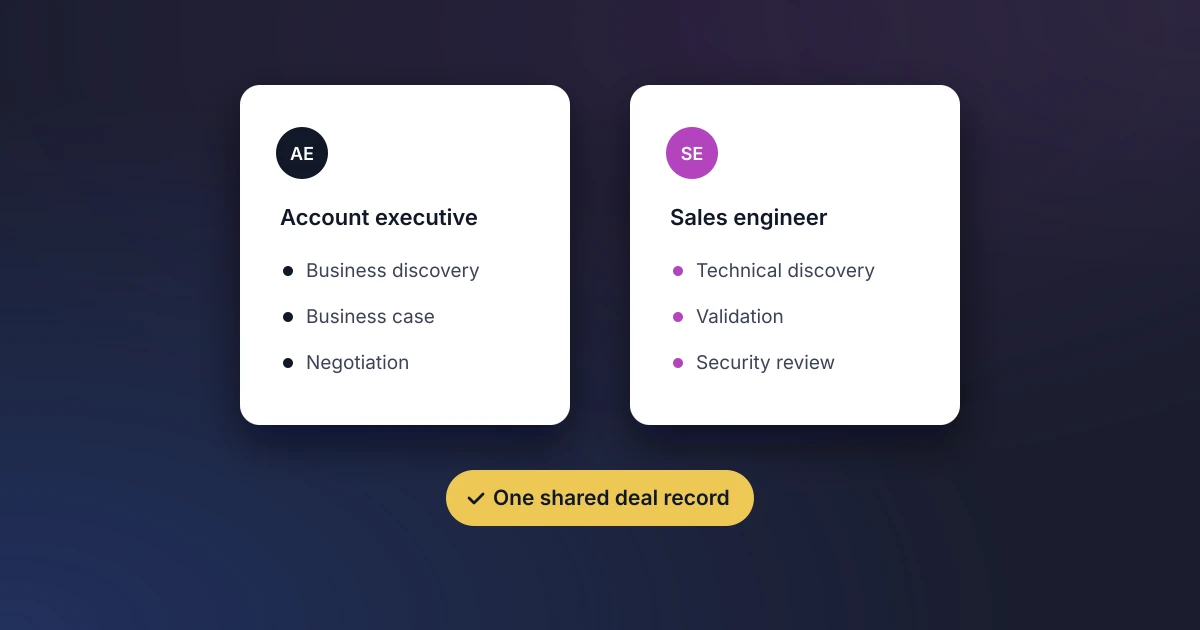
The AE to SE ratio is the number of account executives each sales engineer supports. A 3:1 ratio means one SE covers the technical side of three AEs’ pipelines: discovery, demos, proofs of concept, security reviews and the technical win. Some teams write it the other way round, as an SE to AE ratio of 1:3. Both describe the same thing.
It is the most common way to plan PreSales headcount because it is easy to calculate. It is also easy to get wrong, because it counts people rather than the work they do.
What the Benchmarks Say
Two recent sources are worth knowing. They measure slightly different things, so read them together rather than picking one number.
| Source | Sample | What it found |
|---|---|---|
| Consensus SE Compensation and Workload Report | 600+ PreSales professionals (2025 edition) | 70% of deals require PreSales support. The 2024 edition put the average at about four AEs per SE, with 3 to 4:1 as the likely sustainable limit. |
| NAASE Sales Engineering Signals 2025 | 42 SEs, self-selected (Dec 2025 to Jan 2026) | Most common setup is 2 to 3 AEs per SE (31%), then 4 to 6 (24%). 17% support 7 or more AEs, 17% say it varies and 5% support a single AE. |
The NAASE sample is small, so treat it as a directional signal rather than an industry benchmark. Its conclusion is still useful: there is no single healthy ratio. Lower ratios tend to appear in complex enterprise sales, and higher ratios in SMB and higher-volume motions where demos are more standardized.
Why the Headline Ratio Misleads
Two teams can both run at 3:1 and have completely different workloads. Four things explain the gap.
Deal Complexity
A 30-minute standard demo and a six-week proof of concept with a security review both count as “SE support”. The number of deals per SE matters less than the hours each deal needs.
How Many Deals Need an SE
If 70% of deals need PreSales support, as Consensus found, the remaining 30% are where you can protect capacity. Teams that let SEs join every deal by default run out of time long before they hit their ratio.
Work Beyond PreSales
In the NAASE survey, 93% of SEs reported PreSales responsibilities, but 76% also covered sales enablement, 71% product feedback, 67% post-sale support and 67% renewals or expansion. Every hour spent there is an hour not spent on new deals, so an SE’s real deal capacity is often well below a full week.
Closer Is Not Always Better
One NAASE finding runs against intuition. Among SEs supporting one to three AEs, 40% named AE and SE alignment as a top challenge, compared with 17% of those supporting four or more. The report’s explanation is dependency: when an AE always has an SE to hand, more of the AE’s work drifts to the SE. A lower ratio only helps if ownership is clear. Our sales and PreSales collaboration playbook covers how to set that up.
How to Calculate the Ratio You Need
Start from demand, not headcount. Work it out separately for each segment, because enterprise and SMB deals rarely need the same SE time.
- Count the deals that need an SE. Take the opportunities each AE works per quarter and the share that need technical support.
- Measure SE hours per deal. Use logged activity, not estimates. Include preparation, not just meetings.
- Multiply to get demand. Deals needing an SE, multiplied by hours per deal, gives total SE hours needed per quarter.
- Work out real SE capacity. Take each SE’s working hours and remove enablement, post-sale work, internal meetings and admin.
- Divide demand by capacity. That gives the number of SEs you need. Compare it with your AE count to get your ratio.
Here is an illustrative example with round numbers. Twenty AEs each work six deals a quarter that need an SE, at 25 SE hours per deal. That is 3,000 hours of demand. An SE working 40 hours a week for 12 weeks has 480 hours, and if 60% of that goes on live deals, 288 hours are available. Demand of 3,000 hours needs about 10 SEs, a ratio of roughly 2:1, even though a rule of thumb would have suggested five SEs at 4:1.
The same logic shows why holding a ratio steady is not a scaling plan. Consensus gives the example of a team with 40 SEs at 4:1 whose sales team grows to 230 AEs: keeping the ratio means hiring 18 more SEs. If the PreSales budget does not grow with Sales, the gap has to be closed by working differently.
Signs Your Ratio Needs to Change
The ratio is rarely the first thing to break. Watch these signals instead:
- SEs are joining later. If the stage of first SE involvement moves from discovery to the demo, SEs have no time to shape technical criteria.
- Requests wait longer. A growing gap between an AE’s request and the SE meeting means demand has outrun capacity.
- The win rate lift is shrinking. Compare win rate on deals with and without SE involvement. If the gap narrows, SEs may be spread too thin to make a difference.
- SE hours go to lost deals. If a large share of SE time lands on deals that do not close, the problem may be qualification, not headcount.
- Workload is the top complaint. In the NAASE survey, half of SEs named workload and time pressure as a top challenge, and the same share named weak discovery or qualification from AEs.
How to Get More From the SEs You Have
Before you hire, check how much capacity is being lost. Three changes usually free the most time:
- An entry gate. Agree the minimum an opportunity needs before an SE joins, so SE time goes on deals that can be won.
- A hybrid model. Align SEs directly to AEs on larger deals and assign them from a pool for smaller ones, so specialist time matches deal value.
- Visible capacity. In a McKinsey case study (first published in 2015), a company that gave leaders a view of PreSales availability and skills a quarter ahead staffed 15% more deals with the same team.
None of these work without data. You cannot right-size a ratio if you do not know where SE hours go today.
Where Elvance Fits
Elvance is a PreSales platform built inside Salesforce, so SE capacity is measured on the same Opportunity records your AEs use. Intelligent activity capture syncs with Google and Outlook calendars and logs each SE meeting to the right opportunity, so hours per deal come from real activity rather than estimates. Leaders can see utilization and capacity across the team, assign the right SE to each request, and report win rate with and without SE involvement in standard Salesforce dashboards. That gives you the inputs for the calculation above without a separate system.
Frequently Asked Questions
What is a good AE to SE ratio?
Most teams fall between 2:1 and 4:1. Complex enterprise sales usually need a lower ratio, and high-volume SMB sales can run higher. Calculate yours from SE hours per deal rather than copying a benchmark.
Is a lower AE to SE ratio always better?
No. A lower ratio gives SEs more time per deal, but NAASE found alignment problems were more common when SEs supported fewer AEs. Without clear ownership, AEs can come to rely on SEs for work that should stay with Sales.
How do you calculate SE capacity?
Start with each SE’s working hours and remove everything that is not deal work. Take out time spent on enablement, post-sale support, internal meetings and admin, and what remains is deal capacity. Divide total deal demand in hours by that figure to get the number of SEs you need.
Does AI change the AE to SE ratio?
There is not yet reliable data on how much AI changes it. AI use is already routine for many SEs, with 59% of NAASE respondents using AI tools regularly for tasks such as drafting emails, summarizing discovery notes and answering RFPs. Measure hours per deal before and after you adopt new tools, and let that guide your ratio.
See where your SEs’ time goes, inside Salesforce: book a demo.